- The Bench Brief
- Posts
- 🗺️✨Making the invisible visible through data
🗺️✨Making the invisible visible through data
From ICE detention flows to Du Bois’ early visualizations, this week’s stories show how data can reveal patterns, power and history
Storybench
March 27, 2026
Hey there, Benchers!
Some of the most powerful data stories aren’t just about numbers, they’re about systems and the people within them. From historical charts to modern-day visualizations, journalists are using data to uncover patterns that might otherwise go unnoticed.
In this newsletter, we’re looking at how those stories come together, through mapping, design and storytelling that makes complex ideas easier to understand.
Let’s dig in!
Here is our featured content this week:
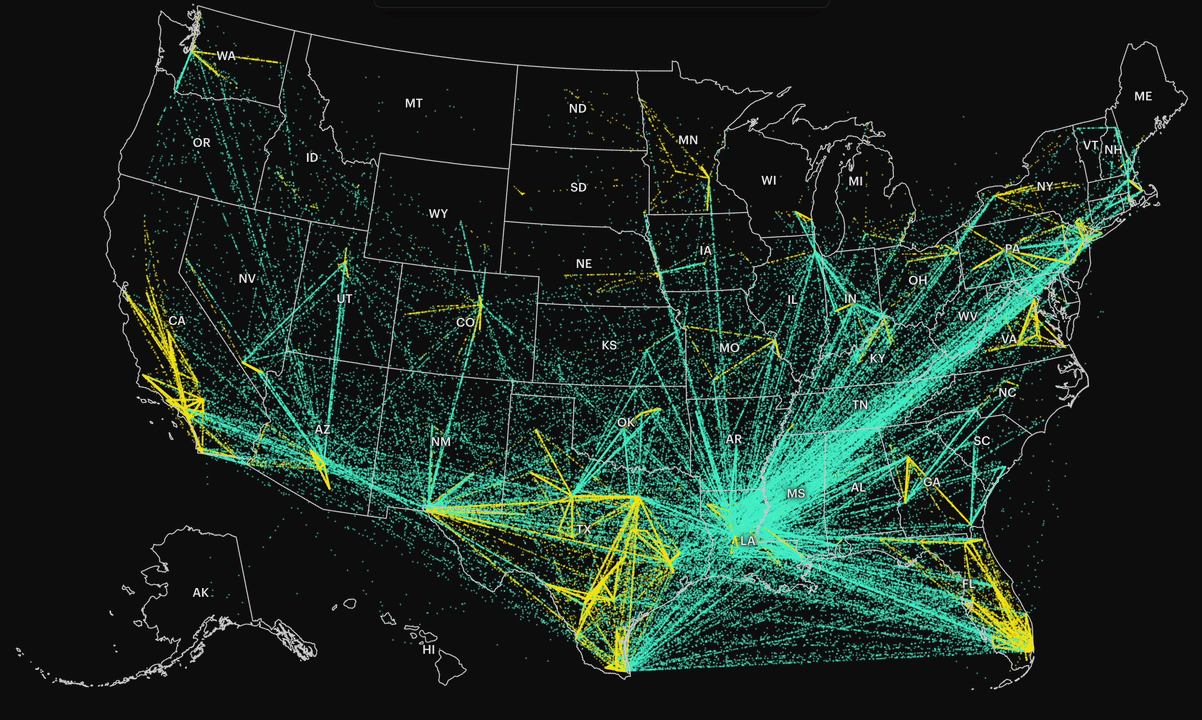
🗺️📍 How I used ICE detention data to visualize the movement within the deportation system
This story breaks down how ICE detention data was used to map the movement of individuals across facilities in the U.S. Each dot represents a person, showing how detainees are frequently transferred across states and systems. The visualization reveals patterns of movement that are difficult to see through text alone. Check it out
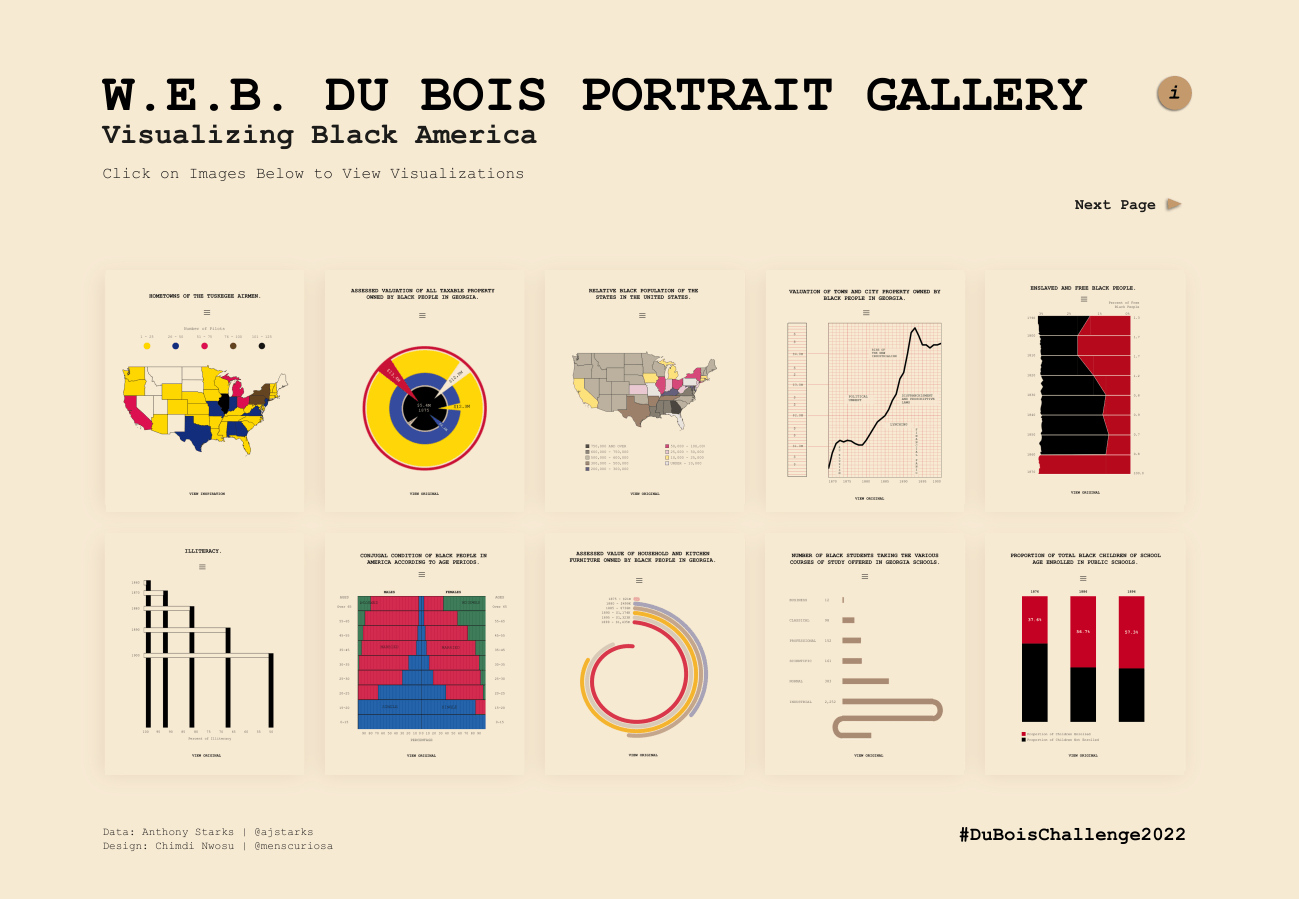
🎨📊 W.E.B. Du Bois data visualizations were a century ahead of their time
More than a century ago, W.E.B. Du Bois and his students created hand-drawn charts to document the progress of Black Americans after emancipation. Using bold colors and simple design, the visuals turned complex census data into clear, compelling narratives. Many of these techniques still feel modern in today’s data storytelling.
Cool Stuff Corner: What are we reading?
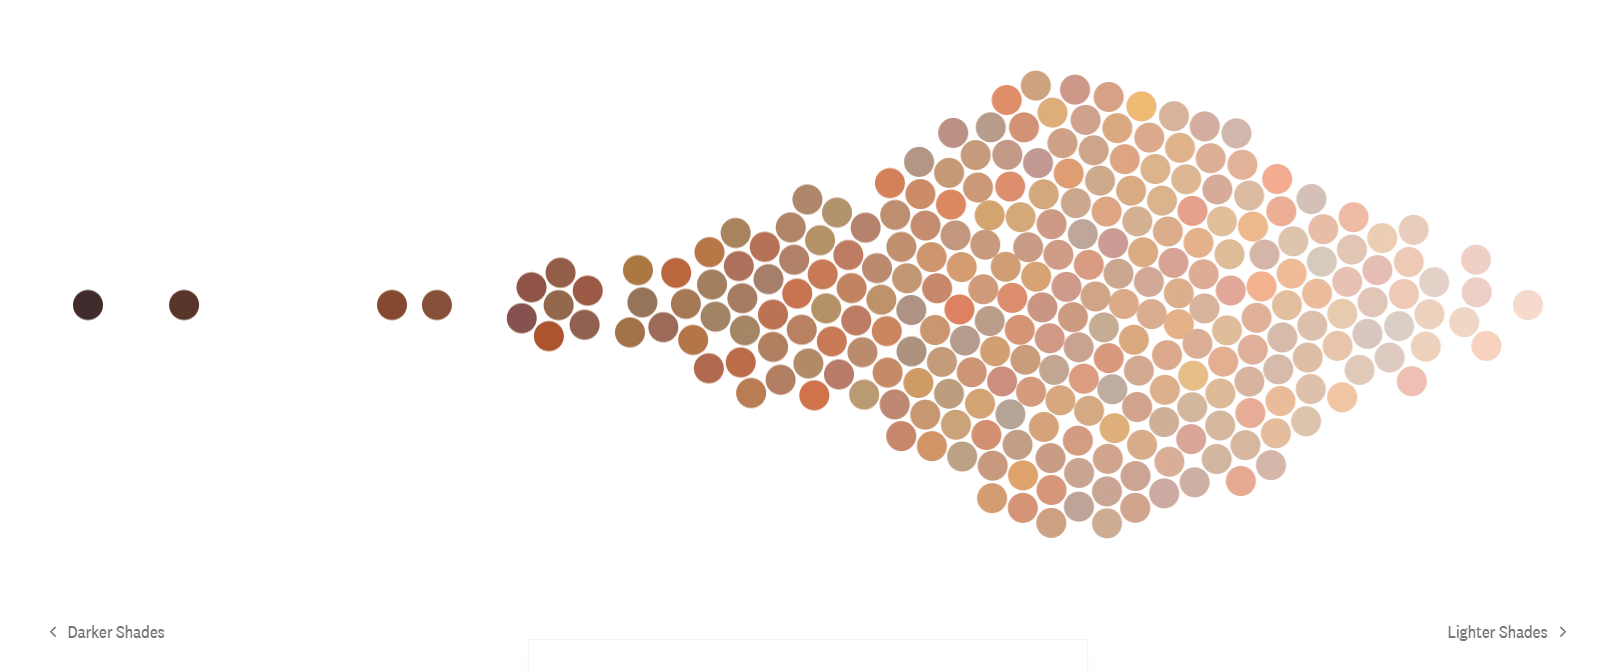
👗📊 Colorism in high fashion
Let’s explore how Vogue covers have evolved over time, analyzing patterns in representation, style and influence. It uses data to track shifts in who gets featured and how fashion reflects broader cultural trends. A strong example of how pop culture can be analyzed through data storytelling.
🏋️♀️🇯🇵 Inside Japan’s muscle girls subculture
An interesting Reuters investigation looks at a growing community of women in Japan redefining beauty through strength training. Through reporting and visuals, it explores how fitness culture, identity and social expectations intersect. The storytelling blends human narratives with broader cultural context. Click here

Did you know?💡
OpenAI has shut down Sora, its AI video-generation tool, less than a year after its public rollout. The company is discontinuing both the app and API as it shifts focus to other AI priorities, including robotics and core products. The move reflects growing concerns around cost, misuse and the future direction of generative video tools.
From the Vault 🏛️
🇻🇪📱 Five Venezuelans that are explaining the situation unfolding in my country
A Feb. 2019 story, highlights how individuals use social media to document and explain the crisis in Venezuela. It shows how firsthand accounts can provide context, clarity and lived experience during complex political situations. A reminder of the role of personal storytelling in global reporting.

📺📊 How to analyze the screen times of presidential candidates
And for our last story, this tutorial walks through how to measure and compare how often candidates appear on screen during coverage. It outlines a method for tracking visibility using data and structured analysis. The approach helps quantify media exposure in political reporting.

PHOTO OF THE WEEK📷
Cover me in sunshine, cover me in good times!!! The wait is finally over - Spring is here. If you’re in New England, do not let those few gloomy days rain over your sunshine smile.
Next countdown: Summer…

Photo credits: @anushka_ram_ @sophiegracee15 @sophie.shabani @mollyyfrench (Northeastern’s official instgram)
That's all we've got for this week! Thanks for reading, and let us know if there's anything you'd like to see in these newsletters or in our coverage at [email protected].
And follow us on Instagram, Twitter (or X, or whatever) and LinkedIn for live updates on stories each week!